What to look for in an uptime monitoring tool
After running an uptime monitoring tool for a few years, here’s my no-nonsense guide to picking a service that won’t let you down, with the features you’ll wish you had when things break.
If your website is how you pay the bills, whether it’s a SaaS, an API, or that side project financing your daily ramen, you need to know when it’s down. Preferably before your customers start angrily spamming that F5 key.
There are thousands of uptime monitoring tools out there, but after running one myself for a few years, here’s what I think you should actually be paying for.
Pick a tool that won’t sleep on the job
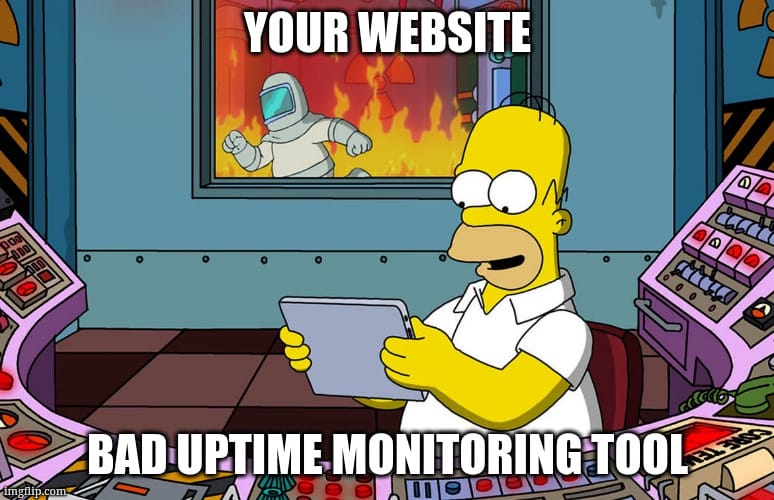
There’s no point in using an uptime monitoring service that’s less reliable than the thing you’re monitoring.

I love indie products (obviously), but this is one of those times where time in the market beats timing the market*.
- Check how long the tool’s been around
- Carefully review stats on their status page, some are... enlightening
- Check out the documentation, it’s usually a good indicator of quality
- Most reviews online are fake, ask your friends instead
*Not financial advice.
Cloud or self-hosted? Choose wisely
Your monitoring system should live outside your infrastructure, spread across multiple data centers, poking your endpoints from different parts of the world. That’s typically not something you get with a self-hosted setup.
That said, self-hosted might make sense if:
- You’re monitoring a closed/private network
- You’ve got confidential credentials involved
- You like the smell of YAML in the morning
If you go the DIY route, open-source projects like Kener and OpenStatus give you slick status pages and great features while being easy to host.
Otherwise, uptime monitoring being a brutally competitive market, good cloud options are often cheaper than spinning up a new VPS, with the benefit of not having to spend time on maintenance.
Pricing that won’t eat your runway
Some tools charge by tiers, others charge by usage. Both can be good, but you do need to know how far your plan will take you.

Keep an eye out for:
- Surprise features locked behind expensive plans, like SSO
- Pricing jumps that increase your monthly plan by 600% to monitor that one additional endpoint
- Per-seat costs (gets expensive fast if you grow)
- Extra costs for things like API monitoring, fancy assertions, or exotic check types
If you’re planning to grow, plan for growth. Otherwise, a cheap starter plan could turn into a budget black hole real quick.
Fast and silent checks
Short intervals of 1 minute to 30 seconds are great, but the increased false positive alerts are not. Make sure your monitoring service confirms failures before it blows up your phone in the middle of the night. Good providers give you:
- Failure confirmation
- Recovery confirmation
- Options to tune how aggressive or chill your alerts are
I wrote a whole guide about this if you want the nerdy details: Best practices to configure an uptime monitoring service
Check from around the world
Just because your site work in Paris does not mean it works in Singapore. Routing is weird. DNS is weird. Internet infrastructure is insanely complex, and sometimes fragile.
If your users are global, your monitoring should be too, especially if you’re doing edge deployments or running multi-region setups.
More than just up and down
“Up or down” is just the start. Depending on what you’re building, you’ll want your uptime tool to handle:
- API checks with custom payloads
- SSL certificate monitoring (inventory, validity, expiration, AIA, OCSP)
- DNS validation
- Performance & response times
- Tracing & diagnostic info
- Custom assertions (e.g., make sure that PHP version header is not present in production)
OhDear is a great example that offers an extensive list of extra checks, like SEO monitoring or broken link and mixed content detection.
Solo today, team tomorrow
Right now you might be a team of one (hey friend 👋), but good monitoring tools support teams, shared dashboards, incident timelines, etc.
Even solo founders need to sleep occasionally. Having a friend or colleague see the same alerts is a life upgrade worth investing in early on.
Plays nice with your stack
Your monitoring tool should work with whatever communication channels you already use, no matter if you’re a Slack, Email, or Webhook person. Alerts should come to you, and not the other way around.
Also keep an eye for generic integration like incoming and outgoing webhooks as well as APIs. They will provide you with ways of integrating a third party or custom-made solution as you grow.
Good logs save bad days
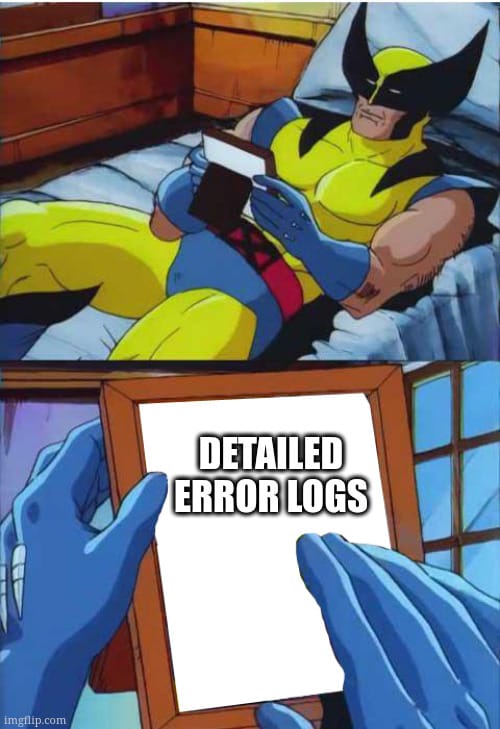
When things break, you need as many details as possible:
- The actual HTTP status code
- The full response body
- Headers
- DNS resolution steps
- Request trace

You could even go further with traceroute logging or screenshot capture. Most cloud solutions provide this. If you’re going self-hosted, you can rig something with webhooks and a great screenshot API like CaptureKit.
It’ll save you hours writing postmortems, debugging edge cases, or explaining to your users why everything went sideways last Thursday.
TL;DR
- Pick a tool you can trust
- Make sure it’s got the features you need today and tomorrow
- Choose something that helps you fix problems, not just point at them
I’m building Phare.io with this mindset, check it out if you’re looking for a great uptime monitoring tool with incident management and status pages. It’s free to start and scales with your needs.
