Best practices to configure an uptime monitoring service
Discover essential tips for setting up reliable uptime monitoring, ensuring accurate alerts and minimizing false positives.
Getting alerted of downtime is an essential part of running a healthy website. It's a problem that got solved a long time ago by uptime monitoring services, but as simple as setting up a monitoring service for your website might seem, there are a few best practices that I learned other the years maintaining dozens of websites from side-projects to Fortune 500, and building Phare.io, my own take on uptime monitoring.
We will dive into some best practices to get the best possible monitoring without false positives, the configurations explored in the article should work with most monitoring services.
Choosing the Right URLs to Monitor
Defining which resources to monitor is the first step to a successful uptime monitoring strategy, and as simple as it might seem, there some thinking to do here.
The first thing to consider is how your website is hosted. Many modern startups will have landing pages on a static hosting provider like Vercel or Netlify, and a backend API hosted on a cloud provider like AWS or GCP. Then you might have external services hosted on a subdomain like a blog, a status page, a changelog, etc. Each of these resources can go down independently, and you should monitor them separately.
For each of these resources, you need to define the right URL to monitor, and there are again a few things to consider:
Static hosting
Most statically hosted websites will use some form of caching through a CDN. If you monitor a URL cached at the CDN level, you might not get alerted when the origin server is down. You then need to check with your monitoring service or your CDN for a way to bypass the cache layer.
Dynamic websites
For dynamic websites or API endpoints, it's tempting to monitor a simple health check route that returns a static JSON response, but you might miss issues that are only visible when hitting API endpoints that do some actual work.
Ideally, the URL that you monitor should at least perform a database query, or execute any critical resources of your application to make sure everything is working as expected. Creating a dedicated URL for monitoring is usually a good idea.
External services
Monitoring external services is usually not as important as you are not responsible for their uptime. However, it's always good to be proactive and get alerted before your users do. This will allow you to communicate about the issues and show that you are on top of things.
Redirections
Now you should have a good idea of the urls you need to monitor, you need to check for any redirections. Be careful with the URL format that you use to monitor your resources, some services will end all URLs with a / and some won't, you will put an unnecessary load on your server if you don't use the right format and will likely get wrong performance metrics on your uptime monitoring service.
Monitoring that a few critical redirections work as expected is also a good idea, things like www to non-www, or http to https redirections are critical for your website SEO and user experience and could be monitored.
Response monitoring
Now that you have defined the right URLs to monitor, you need to define the excepted result of your monitors. In the case of HTTP checks, that will usually be a status code or a keyword on the page.
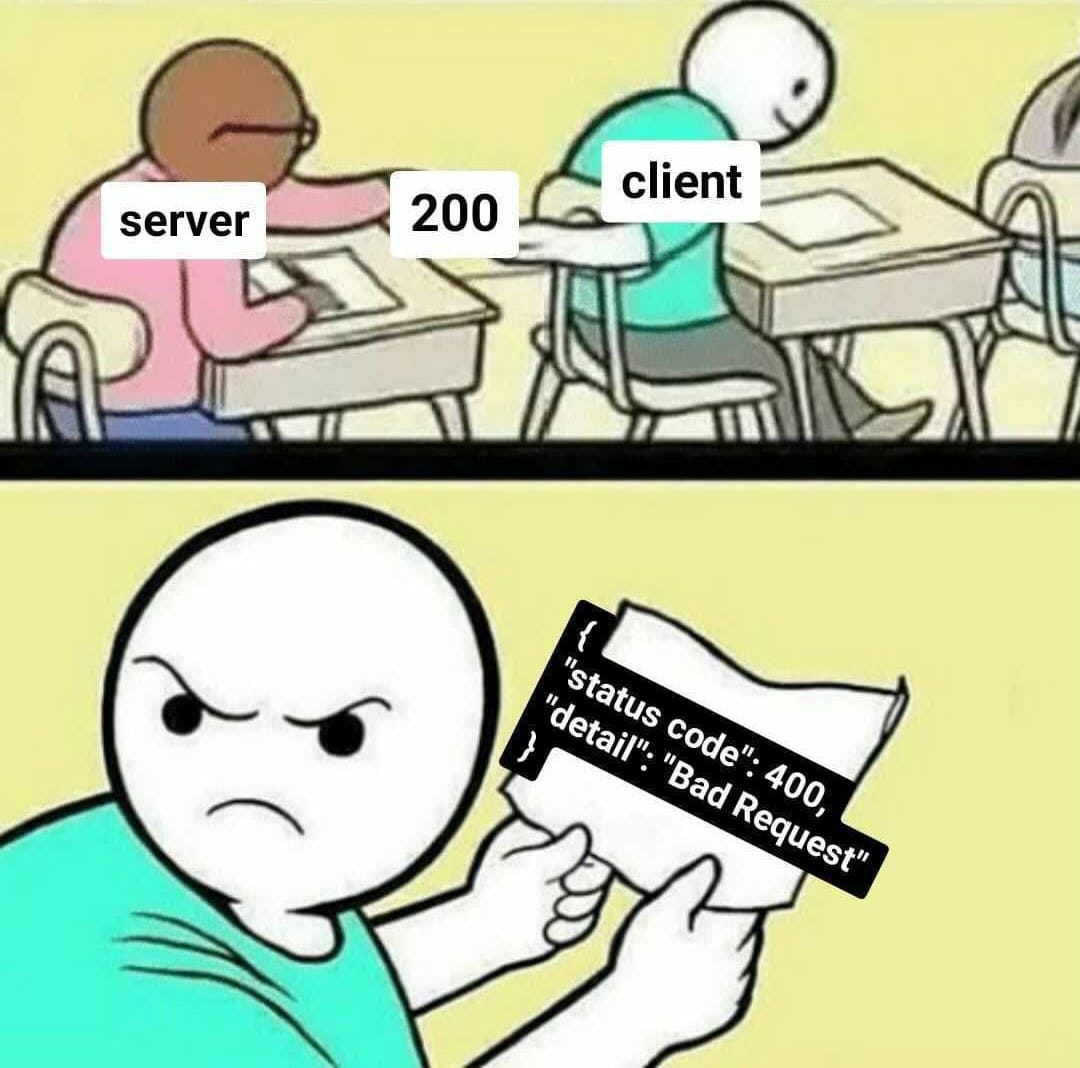
It is common knowledge among web developers that status codes are not always to be trusted, and that a 200 OK status code doesn't mean that the page is working as expected. This is why it's a good idea to also monitor for the presence of a keyword on the page.

A good keyword is something unique to the page that would not be present on any error page. For example, if you choose the name of your website, there's a high chance that it will also be present on a 4xx error page, and you will get false positives monitoring for it.
Request timeout
Finding the right timeout for your monitors is a true balancing act. You want to make sure that the timeout is not too wide to avoid any false positives, but you also want to make sure that it's not too short to get alerted when your server is too slow to respond.
My advice is to start with a large timeout for a few days and then gradually decrease it until you find the right balance. Of course this should be done on a per-url basis, as some resources might be naturally slower than others.
Some monitoring services will have special configurations for performance monitoring that you could use for this purpose, you should also keep in mind that services will calculate response time differently, and you might get different results from different services, so it's always a good idea to start with a large timeout.
Monitoring frequency
The monitoring frequency is another balancing act. You want to make sure that you get alerted as soon as possible when your website goes down, but without wasting resources on unnecessary checks for your website that is up 99.99% of the time and for our beautiful planet.
Choose shorter intervals for critical resources and longer intervals for less important things like third-party services or redirections. You could also consider the time of day and monitor more aggressively during your business peak hours.
Keep in mind the following when choosing the monitoring frequency:
Every 30 seconds = ~90k requests per month
Every 1 minute = ~45k requests per month
Every 5 minutes = ~9k requests per month
Incident confirmations
I would strongly advise against using any monitoring service that does not offer a way to configure a number of confirmations before sending an alert. This is, with multi-region monitoring the most impactful way to avoid false positives.
The internet is a complex system, and a single network glitch could prevent your monitoring service from reaching your server. It might not seem like a big deal, but the more alert you get, the more you will ignore them, and you will certainly miss a real incident after a few weeks of receiving daily false positives alerts.
This setting should be configured based on your monitoring frequency, and the criticality of the resource you are monitoring. The more frequent the monitoring, the more confirmations you should require before sending an alert, here is a good rule of thumb:
30 seconds monitoring interval -> 2 to 3 confirmations
1 minute monitoring interval -> 2  to 3 confirmations
2 to 10 minutes monitoring interval -> 2 confirmations
Any greater monitoring interval -> 1 to 2 confirmations
Multi-region monitoring
Just like incident confirmations, multi-region monitoring is a must-have feature for any monitoring service. It often happens that a request fails temporarily from a specific monitoring endpoint, but it doesn't mean that your website is down.

When checking from multiple regions, uptime monitoring services will usually require a certain number of regions to fail before sending an alert. This is a great way to avoid false positives and make sure that your website is really down for your users.
You should always monitor all resources from at least 2 regions, and more for critical resources. When possible, choose the regions closest to your users this will give you the best results and accurate performance metrics.
Alerting
The last thing to consider is how you want to be alerted. Most monitoring services will offer a wide range of alerting options, from email to SMS, to Slack or Discord notifications.
As we previously established, not all resources are equally important, and you might want to be alerted differently for each of them. Think about the way your company communicates, and how you could integrate the alerts into your existing workflow. You might want to create a dedicated channel for alerts, or use a dedicated email address for alerts. For the most critical resources, you might want to use SMS or Phone notifications, but discuss this topic with your team and make sure that everyone is on the same page. If you configure SMS alerts and the on-call person keeps a phone on silent, that might not be the best idea.
Conclusion
In most cases uptime monitoring is a set and forget kind of thing, but I've seen many teams struggle with false positives and alerts fatigue. By following these best practices, you should be able to get the best possible monitoring without false positives, and make sure that you are alerted when your website is really down.
If you are looking for an uptime monitoring service that helps you implement these best practices, you should check out Phare.io. It's free to start and scale with your needs.
